Since having solar panels and a battery installed, I’ve wanted to understand more of what happens to the electricity we generate. How much stays with us? How much do we share with the grid? What difference is it making over time?
That became an experiment on this site. A day in every ray, with electricity used at home in gold and exports reaching a little further in orange. The shape invites exploration; the figures underneath help explain it.
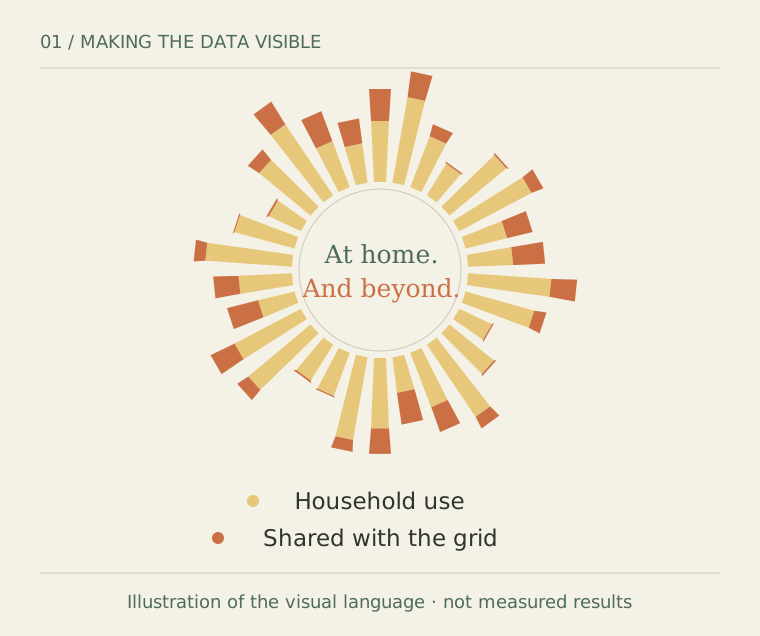
The visual language, illustrated. The experiment itself uses recorded readings; household use is not a claim that every kWh came from solar.
It has also been a useful way to learn more about Laravel and Laravel Cloud. There are three steps behind the picture: collect the data, save a useful result, and share it with the page.
Collect once, share the result
Sigenergy supplies the solar, battery and household readings. Octopus supplies smart-meter history and tariffs. NESO supplies historical grid carbon intensity, helping us estimate the emissions associated with imported electricity.
Laravel makes those requests on the server, validates the responses and prepares the comparisons. Credentials and private financial inputs stay there.
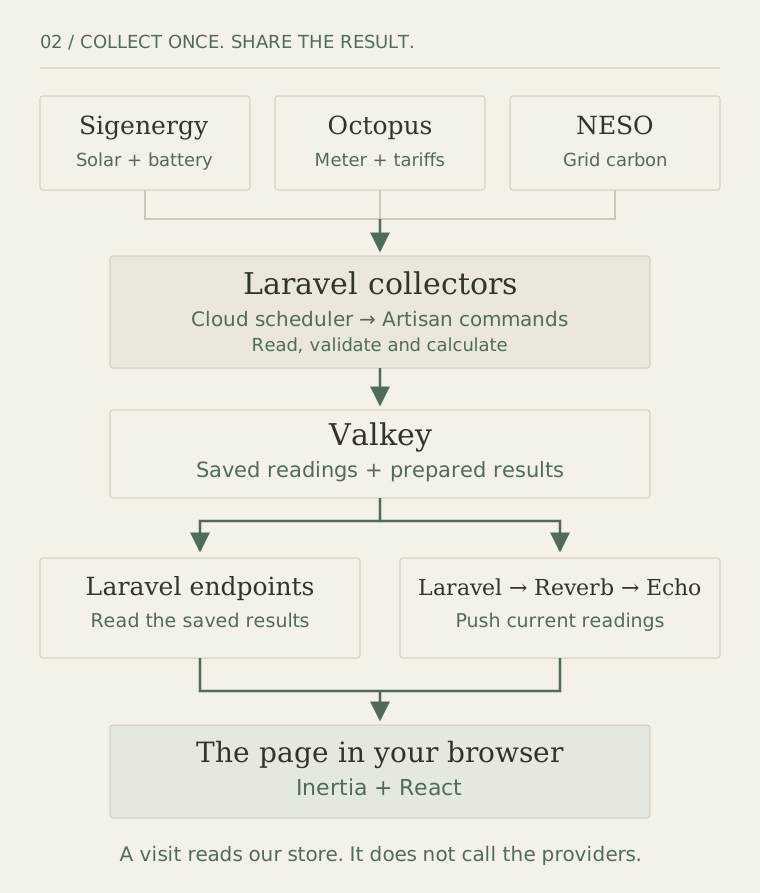
Opening the page reads our saved results. It doesn’t ask all three providers to do the work again. That keeps their response times out of the visitor’s initial page render and avoids multiplying provider requests as more people visit.
Giving the work a timetable
The collectors are Artisan commands - Laravel’s way of running application code from a terminal or the Cloud Commands panel.
For example:
php artisan energy:collect
Our schedule lives alongside the command definitions in routes/console.php:
Schedule::command('energy:collect')
    ->everyFiveMinutes()
    ->withoutOverlapping(2);
With collection enabled in the application and Cloud’s Scheduler switched on, Laravel Cloud runs the scheduled work. I can also run a command manually to initialise or troubleshoot a collection. These collectors don’t need a separate queue worker.
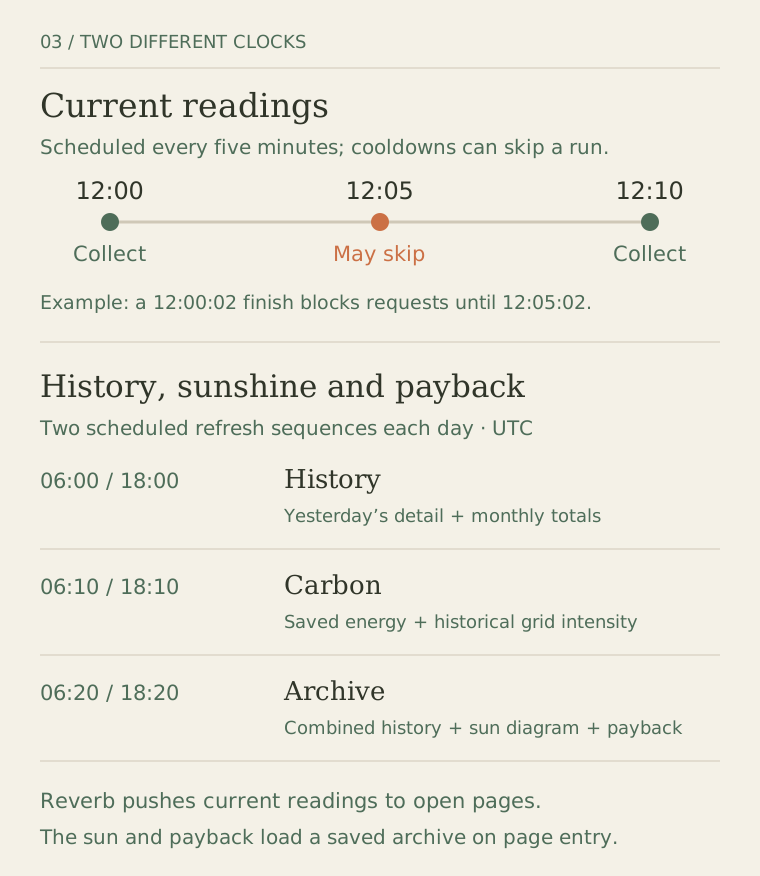
There is a deliberate limit on provider requests. Our five-minute cooldown runs from the end of each current-reading request, so it can skip the next scheduled slot and produce roughly ten-minute gaps. “Live” here means receiving the next collected reading, not second-by-second telemetry.
The sun diagram and payback use completed days and a twice-daily archive refresh. Older monthly checkpoints are reused, so an interrupted collection can resume without starting from scratch.
A shared home for the readings
Valkey holds the saved readings and calculated results. Laravel connects through its Redis-compatible driver.
The latest reading expires after two days and is marked old after fifteen minutes. Shorter history snapshots last 35 days. Archive checkpoints and detailed private evidence have no automatic expiry; private evidence is encrypted, with its own separate store.
Keeping something without an expiry is still different from backing it up. Long-term retention needs that additional care. When a collection fails, we retain the last good result rather than replace it with empty data.
Bringing an open page along
Inertia connects the Laravel application to its React pages. After a new current reading is saved, Reverb broadcasts it and Laravel Echo receives it in the browser. React updates the house illustration without a page reload or a browser polling loop.
The historical sun and payback currently load a saved archive on page entry; they don’t use that push connection.
I like being able to follow the connection all the way through: from something happening on our roof, to a recorded observation, to a picture someone can explore. The picture makes the work approachable. Understanding what sits behind it makes the experiment useful.